All antennas have directional qualities. They do not radiate power equally in all directions. Therefore, antenna radiation patterns or plots are a very important tool to both the antenna designer and the end user. These plots show a quick picture of the overall antenna response. However, radiation patterns can be confusing. Each antenna supplier/user has different standards as well as plotting formats. Each format has its own pluses and minuses. Hopefully this technical note will shed some light on understanding and using antenna radiation patterns.
 |
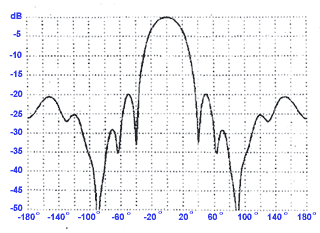
| Figure 1. This figure shows a rectangular azimuth (“E” plane) plot presentation of a typical 10 element Yagi. The detail is good but the pattern shape is not always apparent. |
Antenna Radiation Patterns:
Antenna radiation plots can be quite complex because in the real world they are three-dimensional. However, to simplify them a Cartesian coordinate system (a two-dimensional system which refers to points in free space) is often used. Radiation plots are most often shown in either the plane of the axis of the antenna or the plane perpendicular to the axis and are referred to as the azimuth or “E-plane” and the elevation or “H-plane” respectively.
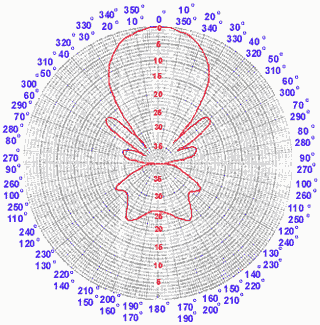
Many plotting formats or grids are in use. Rectangular grids (Figure 1) as well as polar coordinate systems (Figure 2) are in wide use. The principal objective is to show a radiation plot that is representative of a complete 360 degrees
in either the azimuth or the elevation plane. In the case of highly directional antennas, the radiation pattern is similar to a flashlight beam.
 |
| Figure 2. This is a polar plot of the same 10 element Yagi and is similar to a compass rose. Therefore it is more compatible with maps and directions. Note that it shows the sidelobes of the antenna relative to the main beam in decibels. This type of plot is preferred when the exact level of the sidelobes is important. |
In the VHF/UHF and microwave region, the antenna radiation plot shows the relative field intensity in the far field (at least 100 feet or 30 meters distant from typical antennas) in free space at a distant point. Ground reflections are usually not a factor at these frequencies so they are often ignored. The antenna supplier either measures the radiation pattern by rotating the antenna on its axis or calculates the signal strength around the points of the compass with respect to the main beam peak. This provides a quick reference to the response of the antenna in any direction. Notethat the antenna radiation pattern is reciprocal so it receives and transmits signals in the same direction.
For ease in use, clarity and maximum versatility, radiation plots are usually normalized to the outer edge of the coordinate system. Furthermore, most of us are not accustomed to thinking in terms of signal strength in volts, microvolts etc. so radiation plots are usually shown in relative dB (decibels).For those not familiar with decibels, they are used to express differences in power in a logarithmic fashion. A drop of 1 dB means that the power is decreased to about 80% of the original value while a 3 dB drop is a power decrease of 50% or one-half the power. The beamwidth specified on most data sheets is usually the 3 dB or half-power beamwidth.
A 10 dB drop is considered a large drop, a decrease to 10% of the original power level.
 |
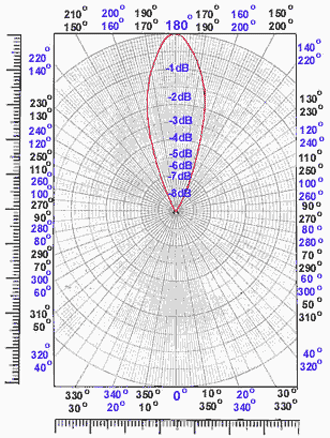
| Figure 3. This is a linear plot of the same 10 element Yagi. Note that it emphasizes the shape of the main radiation lobe of the antenna while suppressing all side lobes making the radiation pattern look better than it really is! |
Another reason for using dB is that successive dB can be easily added or subtracted. A doubling of power is 3 dB while a quadrupling is 6 dB. Therefore, if the antenna gain is doubled (3 dB) and the transmitter power is quadrupled (6 dB), the overall improvement is 9 dB. Likewise, dB can also be subtracted.
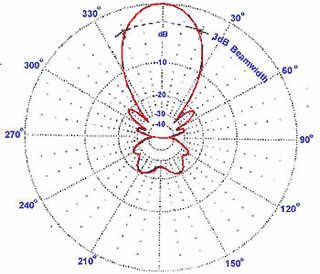
Three types of plotting scales are in common usage; linear, linear logarithmic and modified logarithmic. The linear scale (Figure 3) emphasizes the main radiation beam. Some would argue that this plotting system makes the radiation pattern look better than it really is since it suppresses all side lobes. The linear logarithmic scale (figure 2) is preferred when the level of all sidelobes is important. The modified logarithmic scale (figure 4) emphasizes the shape of the major beam while compressing very low-level (>30 dB) sidelobes towards the center of the pattern. This plotting scale is now becoming quite popular.
How to interpret antenna radiation plots?
An antenna plot is like a road map. It tells you where the radiation is concentrated. Patterns are usually referenced to the outer edge of the plot which is the maximum gain of the antenna. This makes it easy to determine other important antenna characteristics directly from the plot.
Most antenna users are interested in the directivity or beamwidth of the antenna. As mentioned earlier, this is usually referred to as the “half-power” or 3 dB beamwidth, the points between which half the power is radiated or concentrated, and specified in degrees. As an example, the typical half-power beamwidths of a 3, 6 and 10 element Yagi are 60, 40 and 30 degrees respectively.
Another popular antenna specification is the “front-to-back” (F/B) ratio. It is defined as the difference in dB between the maximum gain or front of the antenna (usually 0 degrees) and a point exactly 180 degrees behind the front. The problem with specifying only the F/B ratio is that it does not account for any lobes in the rear two quadrants. Figure 4 shows such an example where the F/B ratio is near 26 dB but +/-30 degrees are lobes that are only 21 dB down.Another important antenna parameter is the side and rear lobe levels (if any). In a well designed antenna they should typically be 10-15 dB below the main beam. This parameter is often important but seldom seen on data sheets. A good logarithmic plot will easily show such lobes and the direction where they are maximum.
 |
| Figure 4. This is a modified logarithmic plot of the same 10 element Yagi which emphasizes the shape of the major beam while compressing very low-level (>30 dB) sidelobes towards the center of the pattern. |
How to use antenna radiation plots?
Antenna plots are the road map for the antenna user. Plots tell you where power is being radiated or received (since they are reciprocal). They also tell you how much degradation you can expect if the antenna is not aimed properly. Sometimes it is desirable to communicate with more than one station. Antenna plots will assist in the proper aiming of the antenna for optimum performance on all the desired signals. The narrower the beamwidth, the greater the difficulty in properly aiming the antenna. Remember that weather phenomenon such as wind may also affect antenna performance or dictate the type of antenna mounting.If there are interfering signals, they may be picked up by the antenna. When you have a radiation plot, you can determine the actual level of such signals. Finally, if there are interfering signals, the radiation plot can be used to minimize them by placing such signals in a null or low sidelobe position.
Conclusion:
Antenna radiation plots are an important tool for antenna designers and users alike. Knowing how to use them will go a long way to compare different antennas and alternative solutions. When the user has this type of data at his/her disposal, the antenna performance can be better optimized to the applications.
Antenna Technologies Limited Company and the author retain the rights to all intellectual property contained herein. This information should be used as a guideline only to help you in the appropriate selection of an antenna.
